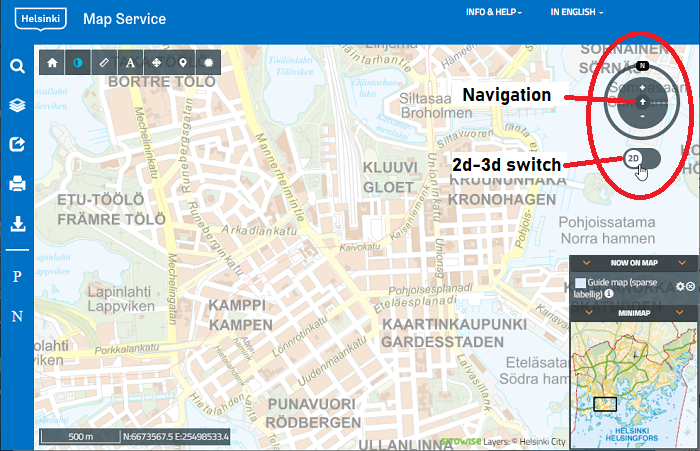
You can switch between the 2D and 3D views by
using the slider under the navigation wheel.
Clicking the slider switches between the 2D and 3D views.
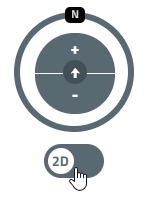
Image: control buttons and the 2D–3D selection slider
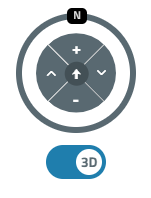
Image: control buttons in 3D view; zoom, positioning buttons and angle
adjustment (up and down arrows)
Getting started and using the map
Before navigating to the 3D view, we recommend switching the map series,
which is the default map layer, to an orthophotograph and zooming the map in
at least a couple of steps so that the initial view shows the area within a
kilometre of the railway station.
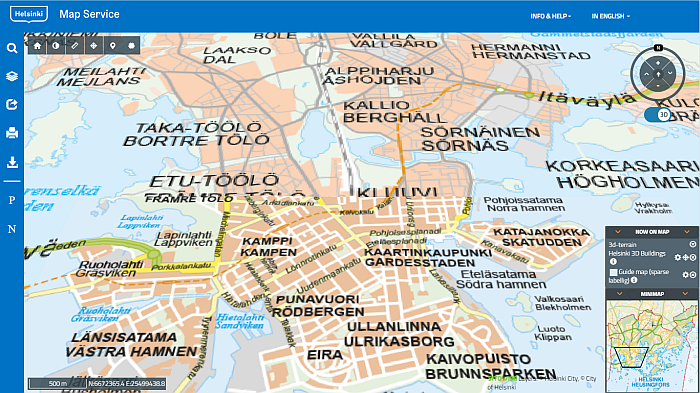
Image: Transition to 3D without zooming in and switching the background
map layer. Only the terrain model is loaded; the building model is not
loaded until the map is zoomed in a few steps.
If you switch from 2D to 3D without preparing the basic 3D mode, you will
notice that only the viewing angle changes from top-down to inclined.
Since the viewing distance is fairly high, the building model is not loaded
in at this zoom level for reasons related to performance and usability.
The buildings will be displayed once the view is zoomed in sufficiently.
In practice, it takes at least two steps of zoom for the building models
to appear.
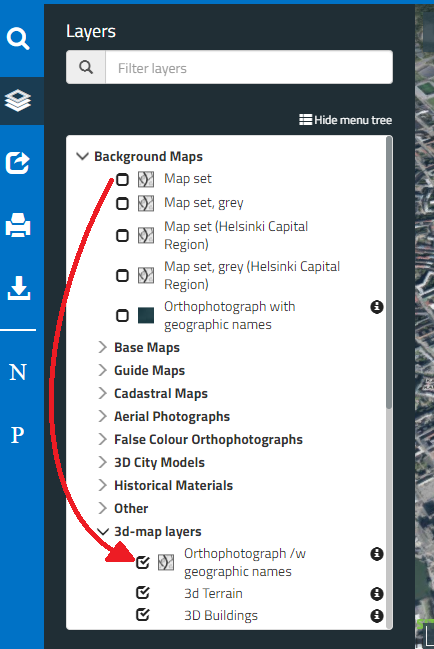
Switching the map layer and zooming in the view ensures an easier
transition to 3D, optimal performance and shorter wait times.
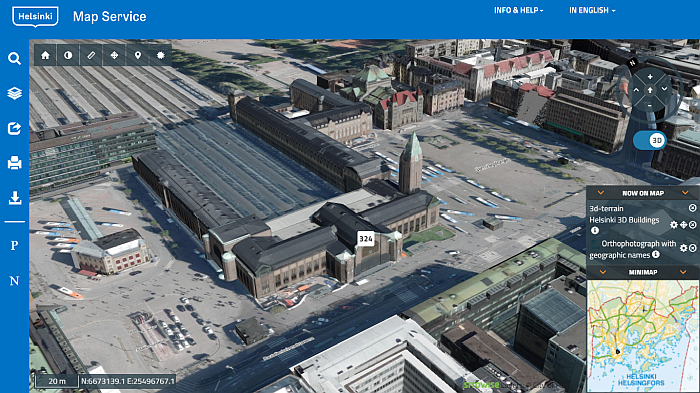
When switching to the 3D view, the map shifts from the normal
top-down view to an angled view, the base map payer begins to conform to the
terrain based on the elevation model, and buildings imported from the 3D building
model begin to appear on the map. It may take some time for the buildings in the
building model to load, depending on network speed, device performance or service
congestion. When you switch to the 3D view, the up and down buttons appear on the
navigation wheel for adjusting the angle (inclination).
You can use the navigation wheel for transitions and adjusting the viewing angle,
but the most convenient way is to drag the map with the mouse cursor, as is done
in the 2D view. You can change the elevation and horizontal angle by holding down
the Shift or Control key and moving the mouse horizontally.
When switching to the 3D view, it may take more than 30 seconds for the model to
be fully displayed. There may be a variety of reasons for any slowness. A slow internet
connection may extend the initial loading time considerably. When the 3D building model
is selected in the 3D view (by default it is), the mouse tooltip shows a number when
the cursor is hovered over a building (image).
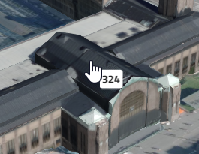
Image: The permanent building identifier for the main building of
Helsinki Railway Station is 324.
This value is called the permanent building identifier. Clicking a building displays
building information report to the right of the map application. The report is the
same as in the buildings layer.
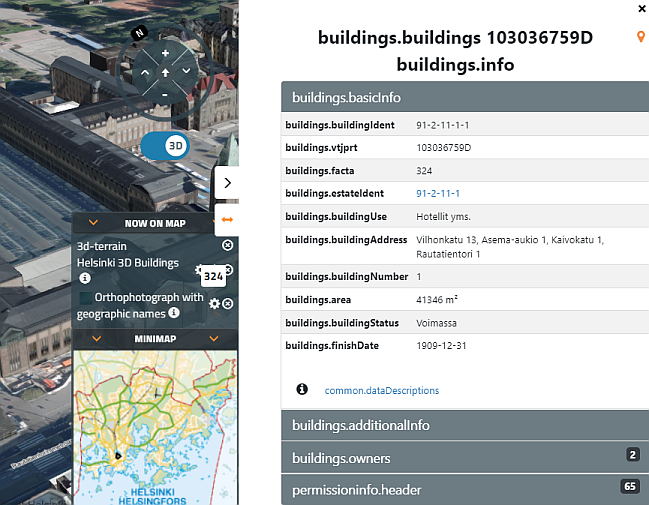
Image: building report of the previous example’s building 324
(main building of Helsinki Railway Station)
Please note that for tight clusters of buildings, the mouse cursor detection
window may penetrate through multiple buildings in the angled 3D view. In this case,
the mouse tooltip displays a stacked list of multiple building numbers.
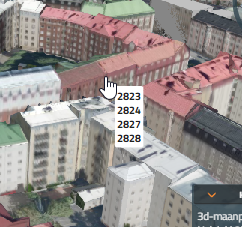
Image: Example of a situation where the mouse tooltip displays the
identifiers of four buildings.
You can resolve the issue by making the viewing angle as vertical as possible
so that you can grab an individual buildings.
Map settings (drawing and shading settings)
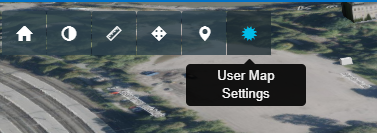
The lighting and shading settings of the model can be adjusted, along with a
few other settings. When the 3D view is active, a new button for map
settings appears in the toolbar.
The lighting conditions of the model can be set based on date and time.
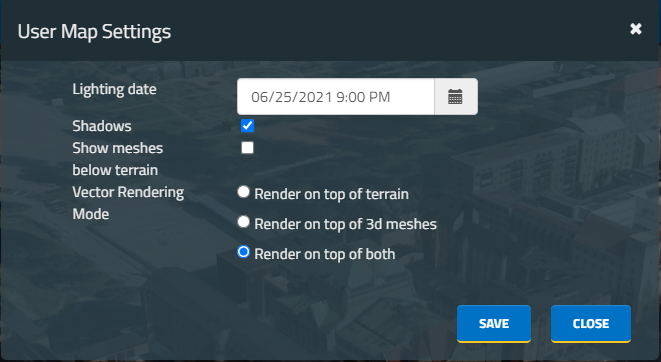
After the modification, the shadows are displayed according to the actual
sun position at that specific time.
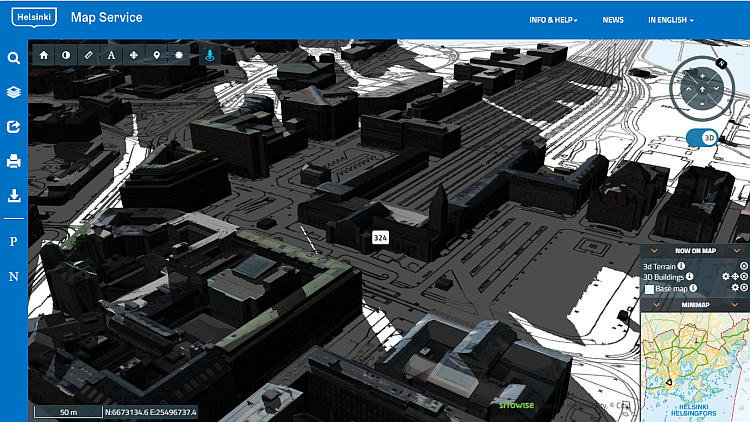
Image: shadows on Midsummer’s Eve 2021 at 9 pm. Base map as the map layer.
You can also use the options to enable underground objects, if there are any.
Currently, the map service does not include underground objects as 3D vector data.
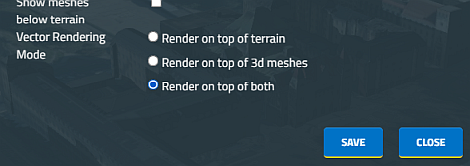
In addition to following the topography, the vectors can also be set to drawn
on top of the building models.
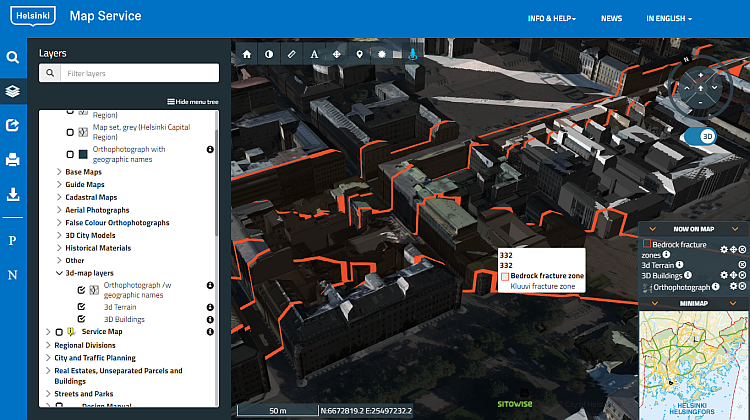
In the example image, vectors indicating the locations of the bedrock
fracture zones are drawn on the building models in addition to the ground.
Things to note about using the data
Due to their nature, the maps (especially aerial photos) used as background map
layers may not be entirely up to date and are obviously dependent on the time at
which the photo was taken. The currency of the terrain or building model is also
dependent on material compilation as the materials are not constantly updated.
It is possible that some newer buildings will be untextured, but the textures
will be added as the service is updated. If the textures are missing, the
buildings are shown as grey shapes.
The timing of the material updates is usually indicated in the metadata,
which can be displayed by clicking the ‘i’ symbol in the materials
tree or legend.